

The global financial landscape just experienced a significant tremor, and the cryptocurrency markets are reacting with massive upward momentum. After weeks of choppy, range-bound consolidation and nerve-wracking pullbacks, a major macroeconomic catalyst has sparked what appears to be a highly anticipated crypto breakout.
In this comprehensive crypto breakout analysis, we will dissect the powerful intersection of macroeconomic data—specifically, the latest Consumer Price Index (CPI) inflation numbers—and real-time blockchain technical indicators. From Bitcoin’s crucial liquidity grabs to a massive $200,000 professional Ethereum trade setup, this guide covers everything you need to navigate this market shift.
1. The Macroeconomic Catalyst: How the CPI “Beat” Fueled the Crypto Rally
To understand the sudden shift in crypto sentiment, we have to look outside the blockchain and into the heart of traditional finance: US macroeconomic policy.
On July 14, 2026, the US Bureau of Labor Statistics released its latest Consumer Price Index (CPI) inflation report. The results completely blindsided the market, coming in far better than anyone had anticipated.
The Numbers Explained
Going into the release, Wall Street economists and market algorithms had priced in an expected year-over-year inflation rate of 3.8% to 3.9%.
Instead, the actual year-over-year CPI printed at 3.5%.
A deviation of 0.3% below expectations is an unusually large “miss” for inflation forecasts. In financial markets, a lower-than-expected inflation print is referred to as an “inflation beat” because it indicates that purchasing power is stabilizing faster than predicted.
| Metric | Market Expectation | Actual Print | Deviation | Market Sentiment |
| Year-over-Year (YoY) CPI | 3.8% – 3.9% | 3.5% | -0.3% to -0.4% | Extremely Bullish |
The “Interest Rate” Connection
Why does lower consumer inflation cause digital assets like Bitcoin and Ethereum to skyrocket? The answer lies in the Federal Reserve’s monetary policy loop:
- High Inflation $\rightarrow$ Federal Reserve raises interest rates to cool the economy $\rightarrow$ Borrowing becomes expensive $\rightarrow$ Capital is pulled out of high-risk assets (crypto and tech stocks) and placed into low-risk, yielding bonds.
- Cooling Inflation (This Beat) $\rightarrow$ Federal Reserve is pressured to stop rate hikes and eventually cut interest rates $\rightarrow$ Borrowing becomes cheaper $\rightarrow$ New capital enters the global money supply $\rightarrow$ Asset prices, especially highly liquid tech stocks and cryptocurrencies, rally.
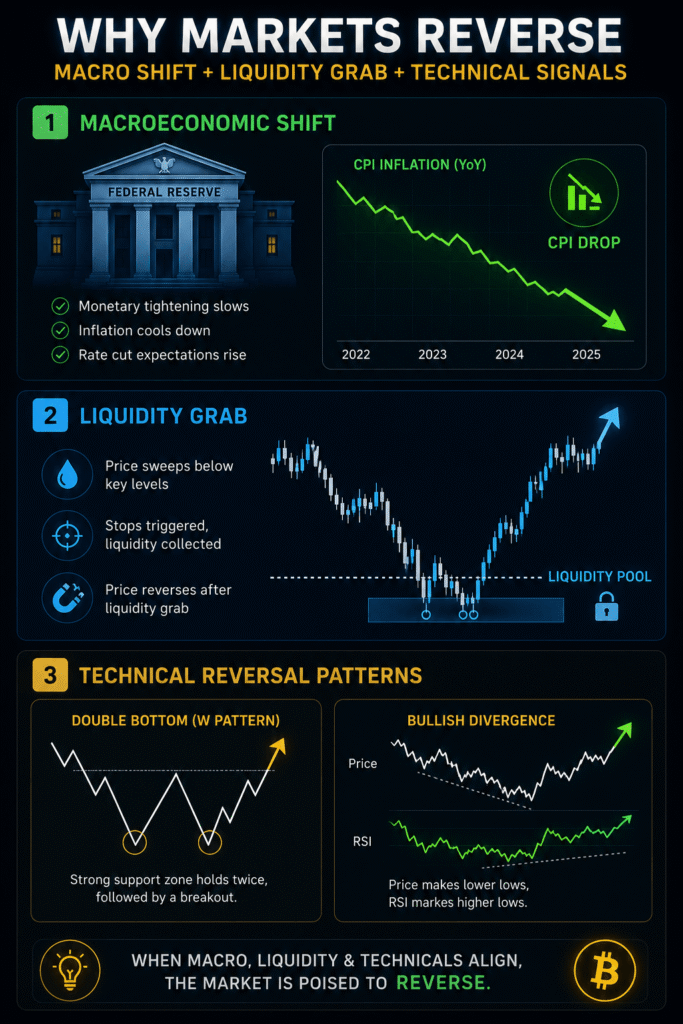
Before this CPI print, futures markets were beginning to price in aggressive interest rate hikes continuing well into early 2027. Following the 3.5% print, the market rapidly began “undoing” those bearish expectations. This sudden repricing process is precisely what triggered an immediate short-term bounce in both the S&P 500, the NASDAQ 100, and the broader cryptocurrency market.
2. Bitcoin Technical Analysis: Liquidity Grabs and Key Targets
Turning our attention to the charts, Bitcoin (BTC) is exhibiting a textbook blend of technical relief and tactical liquidity hunting.
The Weekly and Daily Timeframes
On the high-timeframe weekly chart, the SuperTrend indicator remains technically red. However, a massive bullish divergence has been quietly forming and confirming over consecutive weekly candles. This is the first time a bullish divergence of this scale has confirmed on the weekly timeframe since the absolute bottom of the 2022 bear market—which historically marked a generational buying opportunity.
On the daily timeframe, despite minor short-term pullbacks, the daily bullish divergence remains fully intact. Rather than a vertical, parabolic pump, the current market structure favors a slow, grinding drift to the upside, characterized by range-bound, choppy accumulation.
The Liquidity Grab: What Just Happened?
One of the most critical concepts in modern cryptocurrency trading is understanding the liquidity heatmap. Large institutional traders and market makers do not buy and sell like retail investors; they target dense clusters of leveraged short and long liquidations to fill their massive orders.
Prior to this bounce, a massive pocket of “short liquidity” (stop-losses of bearish traders) was sitting just below the $65,000 mark, specifically concentrated around $64,800.
Following the bullish CPI print, Bitcoin rallied violently to the upside, tapping roughly $64,800 to $64,900 across major exchanges. This move perfectly swept that upside liquidity, effectively neutralizing that specific bullish target.
What Lies Ahead for BTC?
- The Immediate Upside Target: A residual sliver of liquidity remains untouched at precisely $65,000. We could see one more brief push up to clear this level.
- The Downside Support: Downside liquidity still lurks at $61,000. If the stock market experiences a sudden correction, a quick wick down to $61K to flush out late-joining long positions remains a risk.
- The Outlook: With the primary upside liquidity pool already swept, Bitcoin may enter another phase of sideways, choppy consolidation before building the momentum needed to test higher resistance zones.

3. Ethereum’s Massive W-Pattern & The $200,000 Long Strategy
While Bitcoin is grinding, Ethereum (ETH) is preparing for what could be a massive technical breakout. It is currently attempting to break out of a textbook double bottom, also known as a W-pattern, on its 3-day timeframe.
The Trade Setup
Professional traders look for high-probability setups where technical patterns align with macroeconomic windfalls. With the CPI print acting as the wind at Ethereum’s back, a prominent $200,000 long position (utilizing a $20,000 margin at 10x leverage) was re-entered as ETH cleared the critical resistance at $1,800.
At the time of writing, Ethereum is trading comfortably above $1,800, pushing closer to $1,900 and preparing to confirm a daily candle close above the breakout point.
The Profit-Taking Blueprint
Traders executing this W-pattern breakout are using a highly structured, risk-managed profit-taking system:
- The Primary Resistance (1950 – 1970 USDT): This is a key horizontal resistance zone. The plan calls for taking a minor portion of profits (e.g., 10-20%) here to drastically de-risk the position and cover trading fees.
- The W-Pattern Technical Target (2070 – 2090 USDT): Calculated by measuring the depth of the W-pattern and projecting it upward from the $1,800 breakout line. This represents roughly an 11% to 15% move from the entry point. At this target, more than half of the position will be closed.
- The “Moon Bag” Strategy: The remaining half of the position will be left open with a trail-stop loss moved deep into profit. If Ethereum’s momentum carries it past the technical target toward the macro $2,200 – $2,400 resistance area, the trade continues to capture risk-free upside.
Risk Warning: If Ethereum fails to secure a daily candle close above $1,800 and slips back below this psychological line, the W-pattern breakout is invalidated. In this scenario, protective stop-losses should be executed immediately to preserve capital.
4. Altcoin Overview: Solana, XRP, and Chainlink
The broader altcoin market is showing mixed relative strength, highly correlated to Bitcoin’s dominant market footprint.
Solana (SOL)
Solana is currently exhibiting strong defense at a major high-timeframe support zone between $75 and $80. A prominent bullish divergence is active on the 3-day SOL price chart.
- The Bullish Case: If Solana successfully holds above $75, the immediate upside targets lie between $83 and $85.
- The Bearish Case: A confirmed daily candle close below $75 invalidates the setup, opening the door for a rapid descent to the next major support zone at $67 to $68.
Ripple (XRP)
XRP narrowly avoided a devastating technical breakdown over the past 24 hours. While its daily bullish divergence remains technically active, XRP continues to heavily underperform both Bitcoin and its major Layer-1 competitors. Expect highly choppy, sideways action with capped upside until a broader market catalyst injects capital back into the XRP ecosystem.
Chainlink (LINK)
Chainlink’s 3-day chart shows a strong bullish divergence struggling against a massive overhead resistance wall between $8.00 and $8.50.
- Until LINK can firmly break and close above $8.50, its price action is likely to remain restricted to choppy, short-term pullbacks.
- A clean breakout above $8.50 will open up a rapid path toward the next major resistance level at $9.50.
Common Mistakes to Avoid in a Breakout Market
- Failing to Wait for Confirmation: Many retail traders buy the moment a price wicks above a resistance line, only to get trapped when the candle closes back below it (a “fakeout”). Always wait for a confirmed daily candle close to validate a breakout.
- Over-leveraging: Using 20x, 50x, or 100x leverage on altcoins during highly volatile macroeconomic releases is a recipe for instant liquidation. Keep your leverage conservative (e.g., 3x to 10x) and prioritize survival.
- Neglecting the Stock Market Correlation: Cryptocurrencies do not move in a vacuum. If the NASDAQ or S&P 500 begins to roll over due to unforeseen corporate earnings reports or geopolitical events, the crypto breakout will likely stall or reverse.
FAQ: Frequently Asked Questions
What is a “bullish divergence” and why does it matter?
A bullish divergence occurs when the price of an asset continues to make lower lows, but a technical momentum indicator (like the Relative Strength Index, or RSI) makes higher lows. This indicates that even though the price is dropping, the selling pressure is exhausting, often foreshadowing a powerful bullish trend reversal.
What is a “liquidity sweep”?
A liquidity sweep (or grab) occurs when the price of an asset is intentionally pushed to a level where a high volume of stop-loss orders or liquidation prices are clustered. Once these orders are triggered and filled, the price often rapidly reverses direction because the market makers have acquired the liquidity they needed to fuel the next true move.
Is the CPI inflation rate the only macro factor affecting crypto?
No. While CPI is a major catalyst, traders must also watch the Federal Open Market Committee (FOMC) meetings, employment data (Non-Farm Payrolls), and global liquidity indexes.
Why is no-KYC trading popular among some crypto traders?
No-KYC (Know Your Customer) exchanges do not require users to submit government-issued identification to trade. This appeals to privacy-focused traders and global users who live in regions with restricted access to traditional centralized exchanges. However, these platforms often carry unique regulatory and security risks.
Conclusion
Key Takeaways
- Macro Rules: The unexpected 3.5% CPI inflation print beat the 3.8% expectation, signaling a cooling economy and driving stocks and crypto higher.
- Bitcoin Swept Liquidity: BTC successfully swept short-seller liquidity at $64.8K; its short-term upside may now slow down as it enters a range-bound phase.
- Ethereum W-Breakout: ETH is attempting to confirm a vital daily breakout above $1,800, targeting $2,080.
- Altcoins Holding Support: Solana is defending $75, while Chainlink must clear $8.50 to validate its reversal pattern.
Final Thoughts
We are witnessing a highly calculated shift in market structure. While retail investors react emotionally to green and red candles, smart money is trading the combination of macroeconomic relief and structural liquidity pools. Protect your capital, manage your risk parameters meticulously, and let the charts confirm their moves before deploying heavy capital.
Disclaimer: Cryptocurrency trading carries a high level of risk and may not be suitable for all investors. Never trade with money you cannot afford to lose.
🔥🔥🔥🔥🔥🔥🔥🔥🔥🔥🔥🔥
🔒Securely store, manage, and protect your coins with Trezor hardware wallets, app & backup solutions. 👉 41% discount
⚠ Some of the links above are for affiliates. I may receive a commission for you signing up for the platform. Always read the terms and conditions before signing up for any product, platform or exchange. If you are from a restricted region you may get profits rolled back. DYOR and approach at your own risk.
⚠️ Crypto Warning: Always do your own research before using any exchange or service mentioned in this video. Exchanges carry risk, and leverage trading can amplify losses. Terms and conditions may change — read them carefully. Some platforms may be non-KYC now but could require KYC in the future. You don’t have a profit until your BTC is in cold storage or your funds are in a bank account. Stay informed and invest responsibly.