

For nearly five years, Ethereum has been locked in a grinding, structural downtrend against Bitcoin. While Bitcoin has registered explosive rallies—surging more than 660% from its 2022 bear market lows to its recent peaks—the broader altcoin market has largely sat on the sidelines. To many retail investors, it feels like the explosive “altcoin seasons” of the past are a relic of history.
But beneath the surface, the technical and macroeconomic gears are shifting.
A historic Ethereum vs Bitcoin breakout setup is currently forming. It mirrors the exact structural pattern that preceded the legendary 2021 altcoin explosion. This setup, combined with a cooling macroeconomic environment, a weakening U.S. Dollar, and a massive projected surge in Japanese monetary liquidity, suggests that the dormant altcoin market may finally be ready to wake up.
Let’s break down the technical charts, the macroeconomic forces at play, and the exact indicators you need to watch to navigate this potential market rotation.

1. The ETH/BTC Chart: A Five-Year Wedge Nearing Its End
To understand when altcoins will rally, you must understand the ETH/BTC ratio.
Because Ethereum is the undisputed king of smart contract platforms and the liquidity hub for decentralized finance (DeFi), it acts as a proxy for the entire altcoin market. When Ethereum gains ground against Bitcoin, capital naturally flows down the risk curve into mid-cap and small-cap assets. When Ethereum struggles, altcoins bleed.
Historically, this ratio operates in massive macro cycles:
- The 2017–2020 Cycle: Following its June 2017 peak, Ethereum spent roughly three and a half years grinding lower against Bitcoin before finally bottoming out. Once it broke out of that downtrend in early 2021, it ignited an altcoin market mania that lasted for months.
- The 2021–2026 Cycle: The current downtrend began on December 6, 2021. Today, nearly five years later, the ETH/BTC ratio is testing a critical multi-year support floor around 0.028 to 0.035 BTC.
This 5-year consolidation is significantly longer than the previous cycle’s 3.5-year downtrend. In markets, the longer the consolidation, the more violent the eventual breakout.
With the ratio threatening to push past key descending resistance lines, the technical setup matches the early stages of the 2021 trend reversal.
2. Macroeconomics: Why CPI Data Fired the Starting Gun
Many crypto traders fall into the trap of analyzing digital assets in a vacuum. But crypto is no longer an isolated, niche playground. It is a highly integrated component of the global financial system.
The recent market pump across Bitcoin, Ethereum, gold, and silver was directly triggered by the release of cool Consumer Price Index (CPI) inflation data.
Cooler CPI Inflation ➔ Lower Expected Interest Rates ➔ Weakening USD (DXY) ➔ Inflows to Risk Assets (Crypto & Tech)
The Inflation & Interest Rate Connection
Inflation measures the rate at which costs rise. When inflation is high or “hot,” central banks like the Federal Reserve are forced to raise interest rates to cool down the economy. High interest rates are poison for risk assets like cryptocurrencies for two reasons:
- Increased Cost of Capital: It becomes expensive to borrow money, reducing the surplus liquidity that investors use to speculate on high-growth assets.
- Attractive Risk-Free Yields: When government bonds offer high, guaranteed yields, institutional capital has less incentive to seek returns in volatile asset classes.
When CPI inflation prints cooler than expected, the market immediately shifts its expectations toward interest rate cuts.
Following the latest CPI release, the market’s expectation that the Federal Reserve would implement further interest rate hikes dropped from around 45% to just 6%. With the threat of aggressive rate hikes off the table, capital immediately flooded back into global risk-on assets.
3. The Global Liquidity Engine: Japan’s M2 Money Supply
If interest rates are the brakes of the global economy, M2 Money Supply is the fuel. M2 represents the total volume of liquid cash, checking deposits, and easily convertible near-money circulating in an economy.
Historically, Bitcoin price action is almost perfectly correlated with global liquidity cycles.
While the Federal Reserve’s balance sheet gets the majority of media attention, savvy macro traders look to the East—specifically to the Japanese M2 Money Supply.
Why Japan Acts as the World’s Bank
For decades, the Bank of Japan (BoJ) maintained a policy of 0% (or even negative) interest rates. This birthed the global “yen carry trade,” where international institutions borrowed cheap money in Japanese Yen, converted it, and invested it into higher-yielding global assets, including U.S. tech stocks and crypto.
- The Liquidity Lag: Changes in Japan’s M2 liquidity operate on a roughly 84-day (12-week) delay before they physically impact the Bitcoin and crypto markets.
- The Upcoming Liquidity Spike: Leading monetary indicators show a massive liquidity spike headed into the global pipeline. This surge is expected to hit the financial markets throughout late summer and early autumn.
- The DXY Connection: The U.S. Dollar Index (DXY) is currently trading into major resistance. As the DXY breaks down and weakens, global M2 liquidity rises. A weaker dollar is historically one of the strongest tailwinds for a sustained Bitcoin and altcoin expansion.
4. How the Altcoin Market is Positioned Differently Today
A common critique from market bears is that altcoins cannot rally because of the sheer volume of token dilution and the lack of retail interest. However, comparing the current environment to the quantitative tightening era of 2022–2023 reveals distinct structural differences.
During the previous bear market, altcoins faced a hostile “triple threat”: high interest rates, a strengthening dollar, and aggressive Federal Reserve quantitative tightening (shrinking the balance sheet).
Today, those headwinds are turning into tailwinds. The Federal Reserve’s balance sheet has stabilized, and the Institute for Supply Management (ISM) manufacturing index has consistently expanded.
Signs of Divergence
While Bitcoin dominance has remained high, specific segments of the altcoin market have quietly carved out structural higher lows:
- Altcoins vs. BTC Ratio: The collective altcoin market (excluding the top ten major assets) is up nearly 23% against Bitcoin since its December lows.
- A Solid Floor: The “Others” market cap chart (representing the wider altcoin landscape) established a firm bottom in early February. Even during market liquidations, altcoins maintained a valuation roughly 17% higher than those winter lows, showing a steady accumulation phase.
- The Copper vs. Gold Indicator: In traditional finance, the copper-to-gold ratio is used as a classic indicator of economic expansion and risk appetite. Copper (an industrial metal) is currently breaking out against Gold (a defensive safe haven). This macro rotation confirms that global capital is moving from defensive, risk-off postures to offensive, risk-on positioning.
5. Strategic Comparison: Bitcoin vs. Ethereum vs. Altcoins
To build a balanced portfolio, it is vital to understand how these three major asset classes behave during different phases of the market cycle.
| Metric | Bitcoin (BTC) | Ethereum (ETH) | Altcoins (Mid & Small Caps) |
| Primary Role | Digital gold, macro store of value | Smart contract base layer, DeFi collateral | High-beta technology plays, speculation |
| Sensitivity to M2 Liquidity | High (acts as a direct liquidity sponge) | Very High (requires gas and on-chain activity) | Extreme (needs excess speculative capital) |
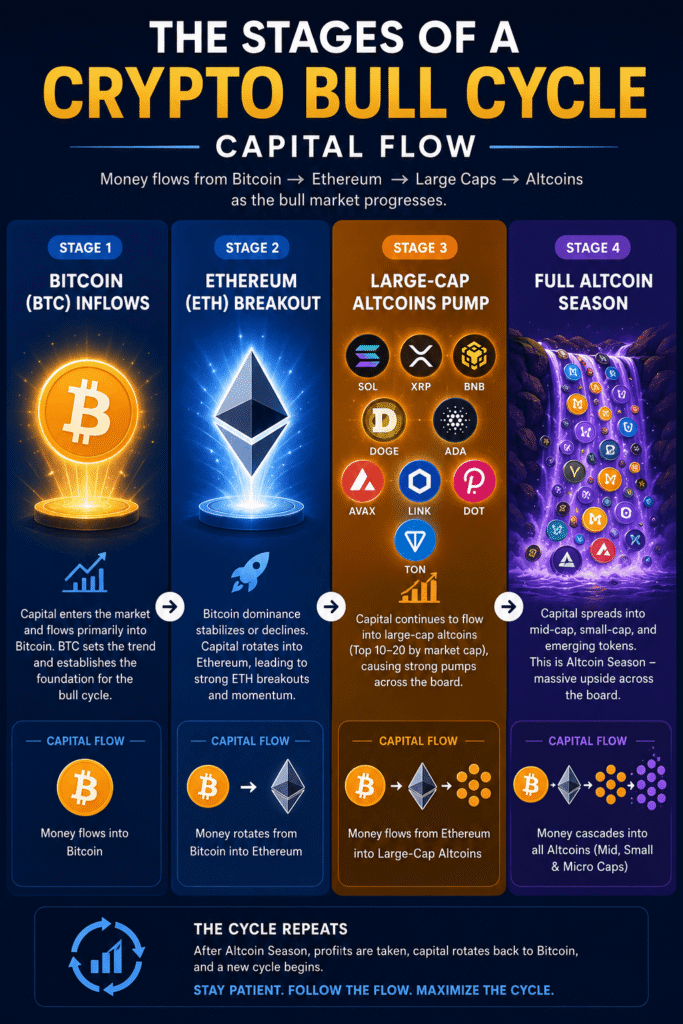
| Performance in Early Bull Market | Outperforms (leads the market recovery) | Consolidates (lags BTC initial run) | Underperforms (bleeds value against BTC) |
| Performance in Late Bull Market | Steady gains (capital starts flowing out) | Outperforms BTC (ignites secondary runs) | Parabolic runs (explosive, highly volatile spikes) |
| Current Structural Phase | Trading near local resistance ranges | Nearing a historic multi-year wedge breakout | Establishing macro accumulation floors |
6. Three Common Mistakes to Avoid in an Altcoin Transition
When the market shifts from a Bitcoin-dominated phase to an altcoin-dominated phase, unprepared investors often lose money due to predictable psychological traps.
Mistake 1: Round-Tripping Profits
Altcoin gains can be fast, furious, and incredibly intoxicating. Investors often watch an asset go up 10x, convince themselves it is going to 100x, and hold it all the way back down to their entry price.
- The Fix: Establish a strict, pre-determined profit-taking strategy. Scale out of positions as they hit major overhead resistance levels, moving those profits back into stablecoins, Bitcoin, or cash.
Mistake 2: Over-Allocating to “Dead” Legacy Projects
Many retail investors buy older, prominent altcoins from previous cycles simply because they are “cheap” relative to their old all-time highs. However, crypto projects suffer from severe narrative decay.
- The Fix: Focus your capital on projects with active developer activity, strong on-chain volume, and fresh narratives (such as Real World Asset tokenization, AI integration, or modular infrastructure).
Mistake 3: Over-Leveraging in High-Beta Assets
Because altcoins are naturally volatile, trading them on margin or high leverage is incredibly risky. A simple 15% spot market correction—which is perfectly normal in a healthy bull market—can instantly wipe out leveraged long positions.
- The Fix: Keep your altcoin exposure strictly in spot holdings unless you are an experienced, professional risk manager.
7. Frequently Asked Questions (FAQ)
What is an “Altcoin Season”?
An altcoin season (or “altseason”) is a phase in the cryptocurrency market cycle where alternative cryptocurrencies (altcoins) significantly outperform Bitcoin (BTC) over a sustained period, typically lasting several weeks to months. This usually occurs when Bitcoin stabilizes after a large run, and investors rotate their profits down the risk curve into higher-beta assets like Ethereum and smaller-cap tokens.
Why is the ETH/BTC ratio so important for altcoins?
Ethereum is the largest smart contract ecosystem and the primary liquidity engine for the decentralized finance (DeFi) space. Because many altcoins are built directly on top of Ethereum or are traded against it in liquidity pools, Ethereum’s strength relative to Bitcoin acts as a leading indicator. When ETH outpaces BTC, it signals that the market’s risk appetite has increased, paving the way for smaller altcoins to rally.
How does the U.S. Dollar Index (DXY) affect crypto?
The U.S. Dollar Index (DXY) measures the strength of the dollar against a basket of major foreign currencies. Because cryptocurrencies are primarily priced in USD, they share an inverse relationship with the dollar. When the DXY is weak and falling, it indicates that global dollar liquidity is expanding, which is highly bullish for risk-on assets like Bitcoin and altcoins.
What is Japan’s M2 Money Supply, and why does it impact Bitcoin?
Japan’s M2 is a measure of liquid money circulating in the Japanese economy. Because Japan has historically maintained ultra-low interest rates, global institutions borrow capital there cheaply to invest in global markets. There is typically an 84-day lag between an expansion of Japan’s M2 supply and a corresponding upward pivot in the price of Bitcoin.
Is it safer to hold Bitcoin or Altcoins right now?
Bitcoin remains the safest and most fundamentally secure asset in the cryptocurrency ecosystem. Altcoins offer significantly higher potential returns but carry vastly higher volatility and risk of capital loss. If you are risk-averse, maintaining a heavy Bitcoin allocation is recommended, while speculative capital can be allocated to altcoins once structural breakouts are confirmed.
8. Conclusion
Key Takeaways
- The Ethereum vs Bitcoin breakout setup is testing a historic, multi-year support floor, mirroring the highly profitable market transition observed in late 2020 and early 2021.
- Cooling macro data (such as the recent CPI print) is shifting the Federal Reserve’s policy away from interest rate hikes, opening the door for risk-on assets to thrive.
- A major projected liquidity injection from Japan’s M2 money supply is flowing through the 84-day global pipeline, poised to boost risk-on assets in the coming months.
- The wider altcoin market has quietly established a strong accumulation floor, showing resilience and quiet outperformance since early February.
Final Thoughts
The crypto market operates in highly structured, liquidity-driven cycles. While the slow grind of the past few years has tested the patience of many investors, the alignment of technical chart breakouts and macro monetary expansion suggests we are approaching a major market pivot.
As the dollar index weakens and the ETH/BTC ratio threatens to break its multi-year downtrend, the stage is quietly being set for a powerful altcoin expansion.
🔥🔥🔥🔥🔥🔥🔥🔥🔥🔥🔥🔥
🔒Securely store, manage, and protect your coins with Trezor hardware wallets, app & backup solutions. 👉 41% discount
⚠ Some of the links above are for affiliates. I may receive a commission for you signing up for the platform. Always read the terms and conditions before signing up for any product, platform or exchange. If you are from a restricted region you may get profits rolled back. DYOR and approach at your own risk.
⚠️ Crypto Warning: Always do your own research before using any exchange or service mentioned in this video. Exchanges carry risk, and leverage trading can amplify losses. Terms and conditions may change — read them carefully. Some platforms may be non-KYC now but could require KYC in the future. You don’t have a profit until your BTC is in cold storage or your funds are in a bank account. Stay informed and invest responsibly.